Also check out below articles
 24-07-2024
Create WordPress plug-ins
WordPress is one of the most widely used content management systems for managing15-11-2021NET 6 now available
Microsoft has released .NET 6 this week this stable fast and versatile framework21-10-2022Maintaining updates and a backup process for your website
Having a website comes with some responsibilities: in addition to regularly27-09-2024Report pages and screens in Google Analytics
There are many different tools you can use to track your website's statistics, with Google Analytics being by far the most popular choice. Thanks to the integration of insights from Google Search Console, Google AdSense and Google Ads, this is often the default choice for many websites. In this blog post, we'll take a look at the Pages and Views report and all the information you can glean from it and use to optimize your website.
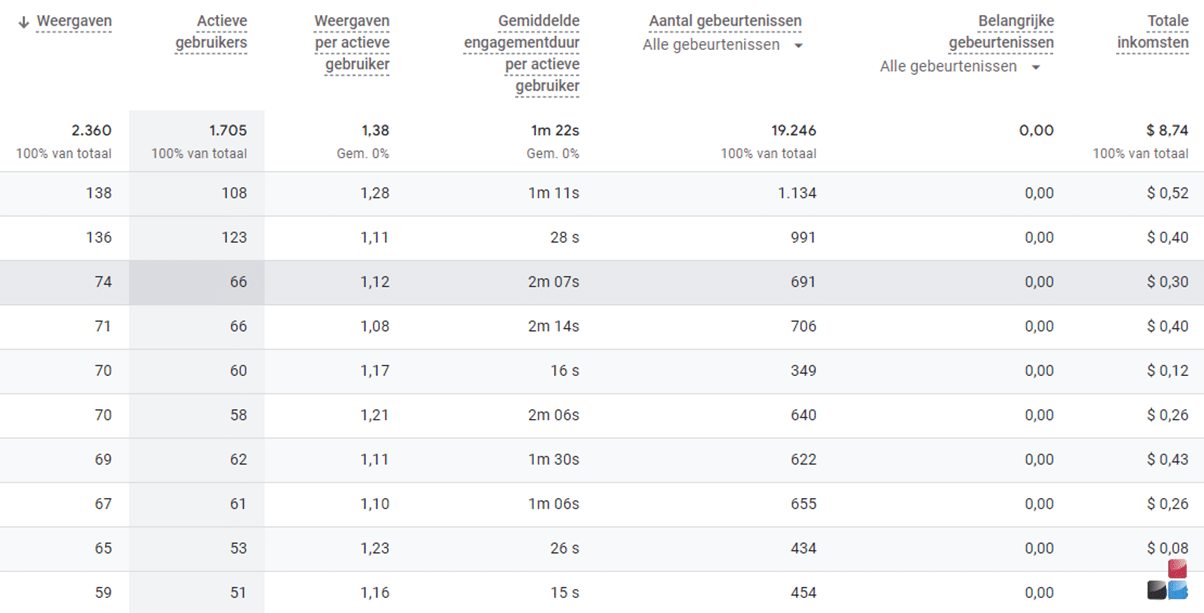
The Pages and Views report is a useful report to keep an eye on regularly as it shows you which pages are being visited and what is happening on them. The most popular content on your site is often an indication of where you can develop further in terms of website hosting and how you can enhance it with related content to drive more results. Of course, this is a metric you can keep an eye on, and is part of a bigger picture that you can use to develop more content for your website.
Where can you view the report?
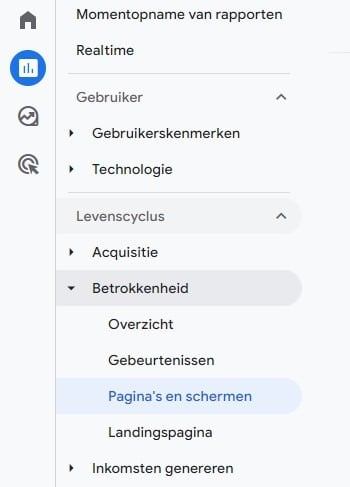
You can view the report in Google Analytics by navigating to Reports -> Lifecycle -> Engagement -> Pages and Screens.
You will then see the results in the selected date range, and you will see the 10 most popular pages. To expand the results further, you can use the following function:
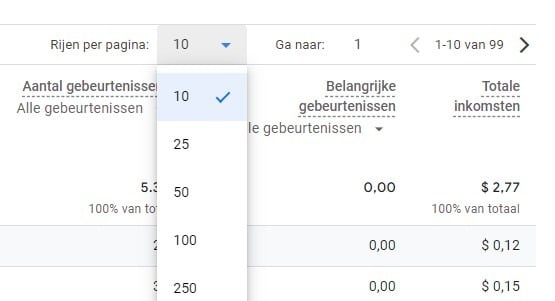
The rows per page are then expandable to the result you have posted, in this case there are a total of 99 pages that have been visited on this site in this time frame, and so set the report in this to 100 rows to see all pages in one view.
Set the time frame for the report
The time frame or date range of the report needs to be set to the range you want to get the insights from, within Google Analytics 4. Rather, you should refer to the last week or the entire month. Finally, the most recent results in Google Analytics 4 are not complete and are often only displayed in full after 24 to 48 hours. So take this into account in your reports.
Average time spent on the page
The average time spent on the page is another key figure that gives an indication of whether it also corresponds to the visitor's interests. If on average only a few seconds are spent on the page, this is often a negative sign. And therefore often needs to be revised or improved to fit better. For example, consider whether the page can be displayed well on all devices, whether it has a catchy lead that invites visitors to read on. And whether it has an interesting image.
Your most popular pages and sources of traffic
The most popular pages with the most visitors can also tell you how well your website is performing. It's often a less positive sign if a large proportion of your overall traffic comes from one or a few pages and stays there. Should something change, such as a Google search result, an ad or a social media post that delivered that traffic, a large portion of your total traffic will immediately drop away.
It is therefore advisable that your traffic comes from and lands on many different sources and pages.
If one of these sources drops out, the majority of your traffic is not immediately gone. You can view the sources of traffic by going to the Acquisition report in the Google Analytics reports. We'll cover this in tomorrow's blog post, so stay tuned to our blog posts on social media so you don't miss this!